Estimating one year inflation centered on the current month rather than six months prior
January 17, 2025
Media discussions of inflation releases like this one or this one highlight one year and one month percentage changes in prices. The one year figure is stale: half of it reflects economic developments that are over six months old. The one month figure is up to date but too volatile to be useful.
What we would like is a one year percentage change centered over the current period, but naturally that won’t be available for another six months. However, we can estimate that figure with annualized percentage changes taken over various lags. The best estimate for one year centered inflation turns out to be six or seven months long. Here’s the first chart measuring the errors for various lags: we want errors to be low:
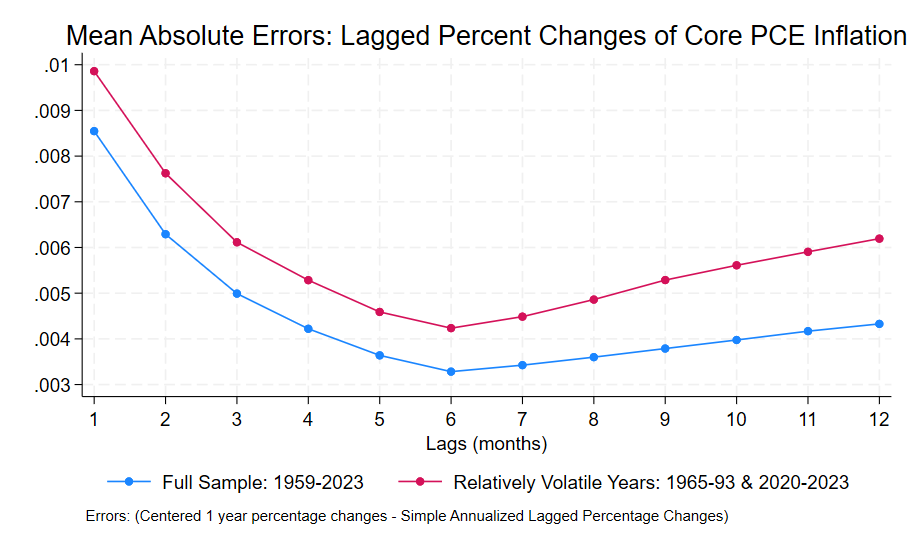
For both 1959-2023 and a subset of that era when inflation fluctuated a lot, annualized six month lagged percentage changes approximated one year centered inflation best. One month inflation annualized inflation produces errors about 2 and a half times as high. The one year lagged percentage change, emphasized in most inflation reports, has higher errors than any lag between 4 and 11 months.
Memo to reporters: calculate the annualized 6 month lagged percentage change! And download my paper! The next post will discuss annualization in greater detail and provide a formula.
Edit April 20, 2025: update with latest version of paper.