Review of Core PCE report for November, Released on Dec 20, 2024, Part II
January 27, 2025
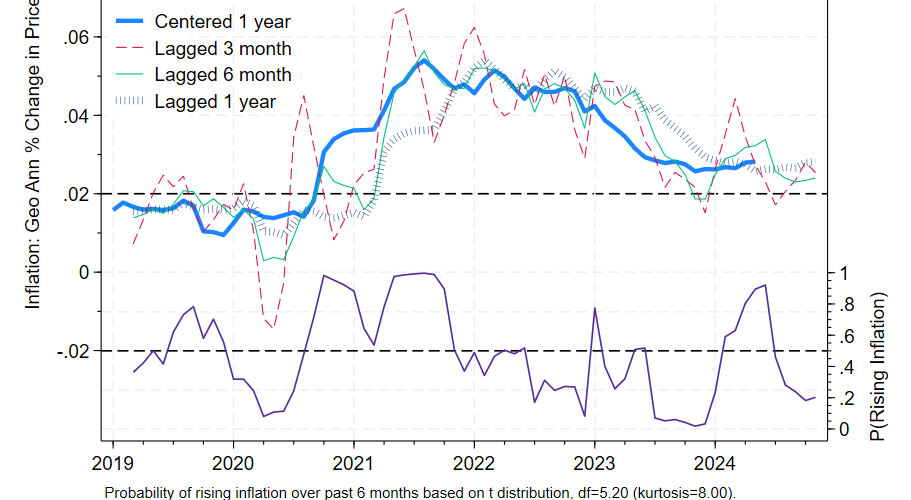
Here is a more proper update of the graph in my paper, reflecting the inflation data as it was initially reported at the time, relative to the revised centered one year percentage change in prices represented by the thick blue line.
The data starts in March 2019, because there were delays in reporting core PCE prices due to a US government shutdown in Dec 22, 2018 to Jan 25, 2019. The updated graph reflects similar data on the right of the chart, with 6 month annualized inflation being slightly lower than inflation measured over the previous year, and inflation generally easing over the previous six months.