Josh Marshall challenged his readers to create an economic dashboard to track the economy’s performance during the Trump administration. My attempt isn’t a side-by-side comparison with the two administrations (that can come later), but rather a snapshot of the economy inherited and what has happened since.
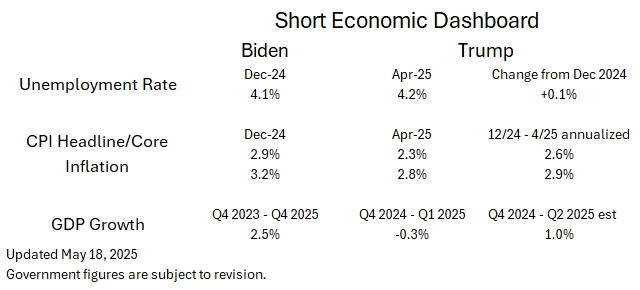
Unemployment and inflation are about where they were at the end of last year, at least through April. Unemployment rose by a trivial tenth of percentage point and progress on inflation has stalled above the Fed’s 2.0% target.
Inflation adjusted GDP declined in the first quarter. The mild 2 quarter annualized growth rate in the bottom right-hand corner is based on nowcasts by the St Louis and New York Federal Reserve. New York updates weekly; St Louis updates more often. The New York website provides a fair amount of detail including a range of probabilistic estimates. They say that there’s a 68% chance that growth will end up somewhere between 0.73% and 3.94% — quite a wide range.
Expanded dashboards could include manufacturing employment, output, and productivity growth, overall productivity growth, and median wage growth. Energy independence could be measured with the difference between nationwide energy production and consumption. I could also include mortgage rates.