February 12, 2025
Core CPI increased 0.4% in the month of January, with headline CPI increasing 0.5%. Over the past year all items CPI increased by 3.3%. Bloomberg reports that Federal Reserve Chairman Powell state, “I would say we’re close, but not there on inflation.”
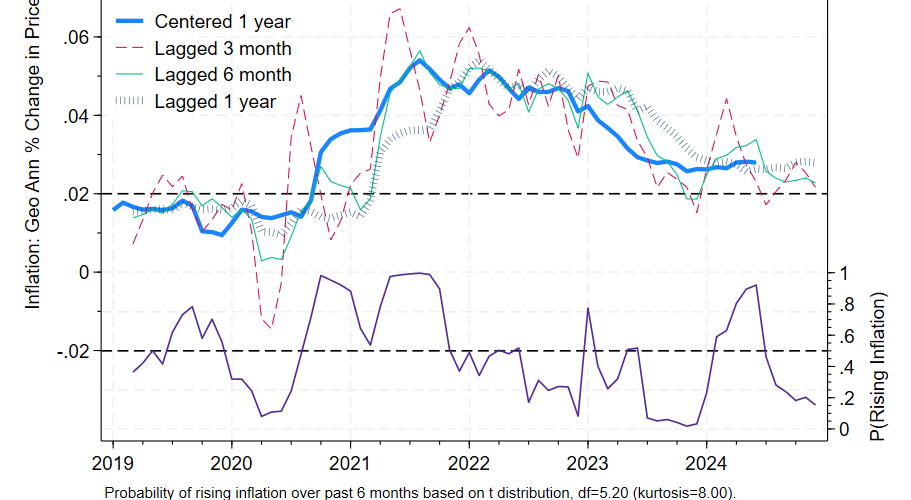
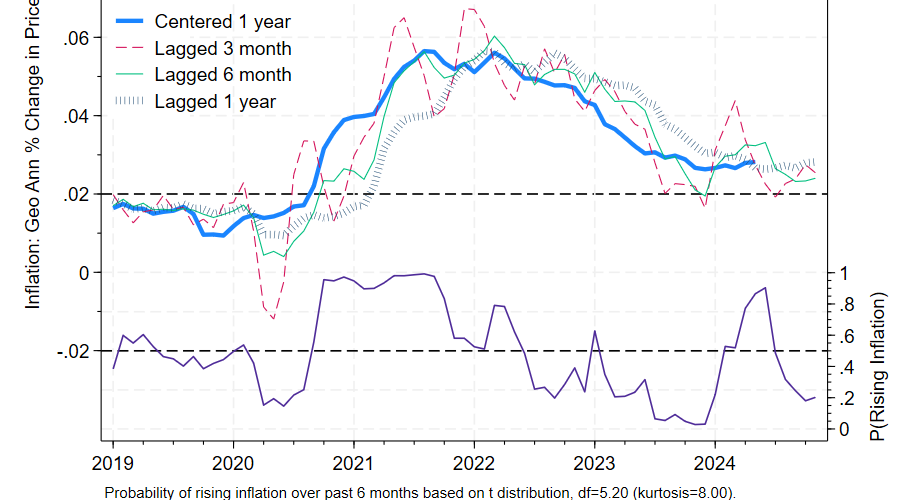
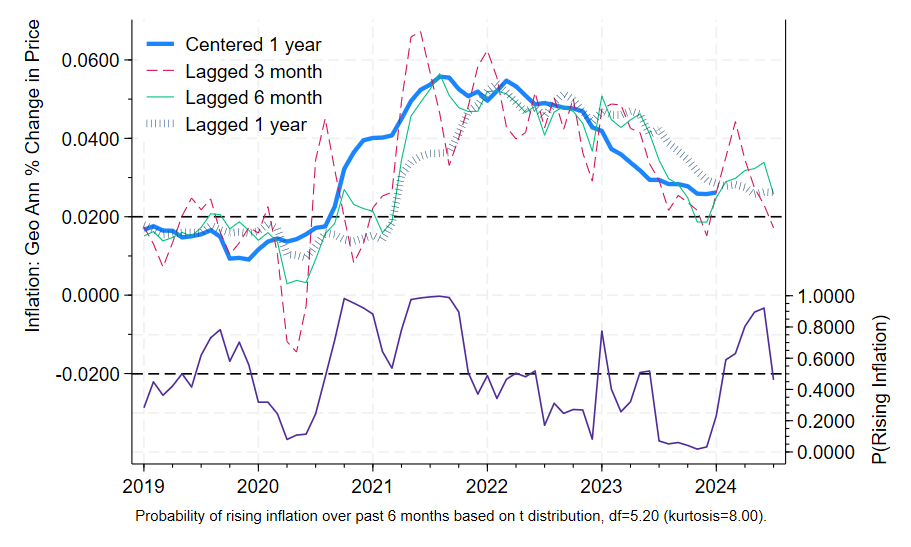
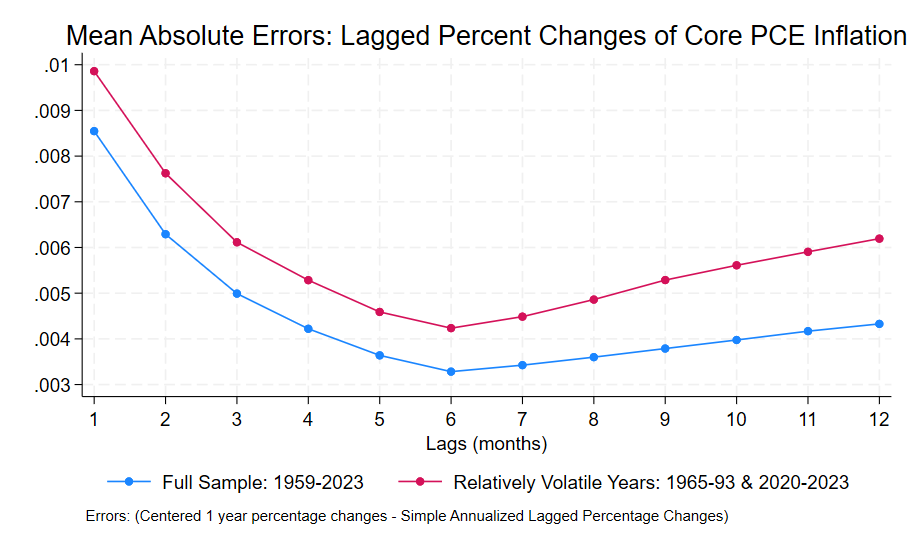
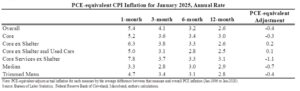
Over at Bluesky and X, Jason Furman presents the CPI report, with prices reweighted to track the PCE: see the image above. He notes that his weights have been overestimating the PCE figures lately, so perhaps the PCE-equivalent adjustment should be moderated. The one month figure is too noisy to pay attention to. The one year figure is dated. My appendix shows that the 6 month figure is the sweet spot for Core CPI as well. With 6 month inflation at 3.4% and rising, we are a ways from the Fed’s long run 2.0% target.
If you must forecast, forecast often. That said, based on this report I would expect a shift to more restrictive language in the Fed’s statement during the March 18-19 meeting barring a very dramatic shift in the data between now and then.