July 2, 2025
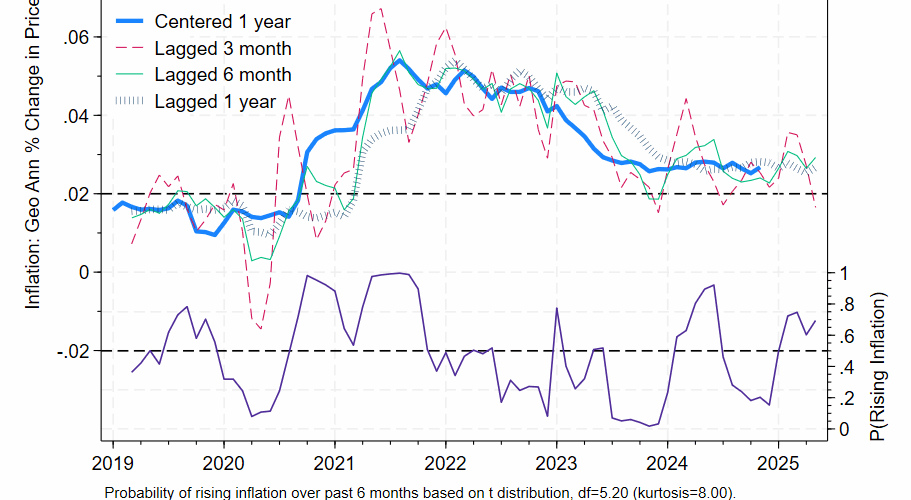
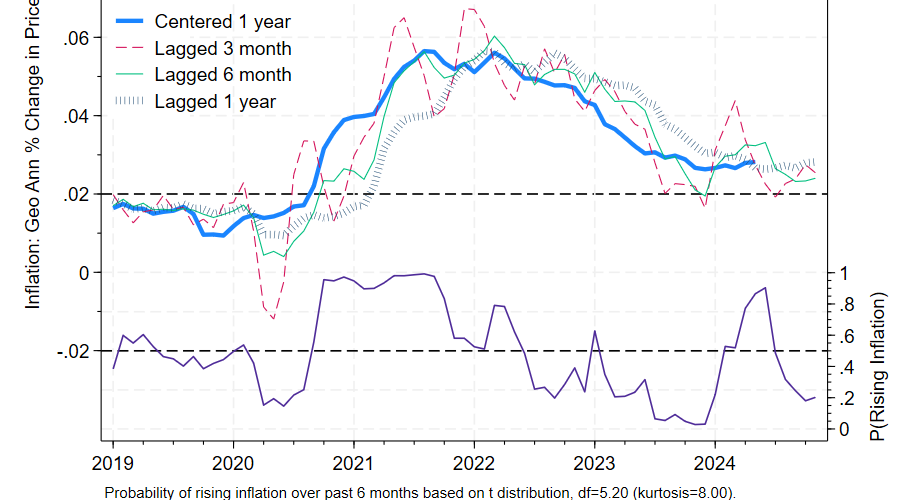
The one year percentage change for May’s core PCE report came in at 2.7%, which gives an idea of 1 year inflation centered on November 2024. The best forecast of inflation centered on May 2025 is the annualized six month percentage change, which was a slightly higher 2.9%. The probability that centered inflation has rose over the past 6 months is at 69%.
Inflation is somewhat elevated and probably increasing. The Fed Funds is at 4.3%: subtracting out 2.9% gives an estimated real rate of 1.4%. Since January 2000 that figure averaged at *negative* 0.1%, but during the 1990s it averaged + 3.9%. So the fed funds rate is little high for this century, but not anywhere near as tight as it was during the 1990s.