Six Month Lag

Inflation, finance, economics.

Browsing:

Tag: Core PCE

Price pressures were increasing before the Iran War

Today’s core PCE release covered prices through February 2026. The Iran War began with February 28 airstrikes on Iran by the US and Israel; the latest release thus establishes a baseline before oil and natural gas prices began their upward climb.

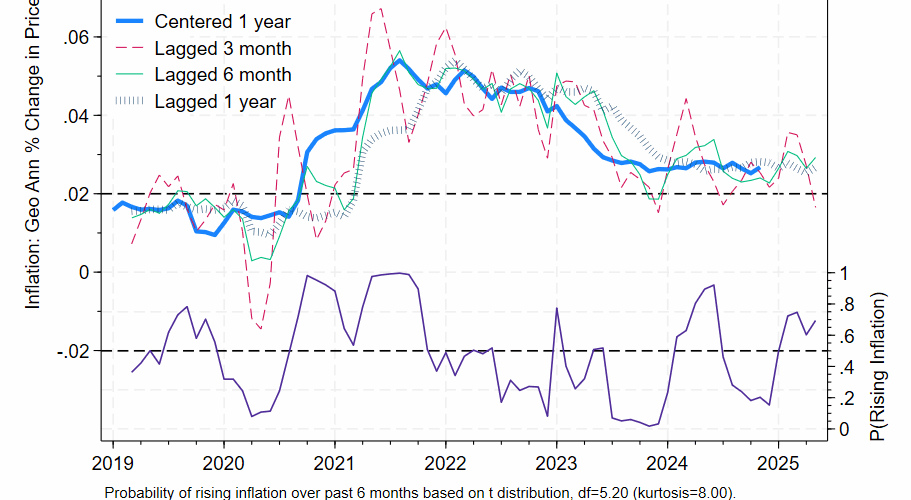
The preferred 6 month percentage change in core PCE ticked up to 3.4% in February; the more commonly reported 12 month percentage change was 3.0%. My model suggests that the probability that underlying inflation has increased over the preceding 6 months is 81%. The report implies elevated price pressures before the Iran War started. We are a ways away from the Fed’s 2.0% long run target.

Annualized three month percentage changes in inflation were 4.4%, but I would ignore that figure: you can see how noisy the red dashed lines are above. Focus on the light green line, which best estimates the thick blue line showing underlying inflation, but only with a lag.

The graph above reports real time unrevised data, so that the probabilities in the lower portion are meaningful and comparable. There’s a break in the series for October 2025 due to the government shutdown, which is smoothed over above.


Core PCE inflation report for May 2025: trending upwards

The one year percentage change for May’s core PCE report came in at 2.7%, which gives an idea of 1 year inflation centered on November 2024. The best forecast of inflation centered on May 2025 is the annualized six month percentage change, which was a slightly higher 2.9%. The probability that centered inflation has rose over the past 6 months is at 69%.

Inflation is somewhat elevated and probably increasing. The Fed Funds is at 4.3%: subtracting out 2.9% gives an estimated real rate of 1.4%. Since January 2000 that figure averaged at *negative* 0.1%, but during the 1990s it averaged + 3.9%. So the fed funds rate is little high for this century, but not anywhere near as tight as it was during the 1990s.


Review of Core PCE report for November, Released on Dec 20, 2024

With the next PCE report coming on Jan 31, 2025, I thought I would review the report released last month. The above graph is a little different than the last post as it only uses the latest revised data and doesn’t bother to dig out inflation rates as they were originally reported. Comparison of the red, green, and inchworm lines, as well as the purple probability line, with the last post shows that the effects of the approximation are more than trivial.

One year core PCE inflation came in at 2.8%: inflation over the past year gives us an idea of general price pressures as of 6 months ago, halfway through the time span. The annualized six month lag provides the best estimate of centered inflation as of November 2024: that was 2.4%, a little lower.

Price pressures eased: given historical experience we’d expect November’s centered inflation to come in lower than centered inflation in May (6 months prior) about 80% of the time.

The Federal Reserve has a long term target of 2.0% inflation: the latest report indicates steady progress towards that goal as of November 2024.

ETA Jan 26, 2025: See the next post for a much better graph.